Introduction
As my Raspberry Pi cluster began hosting more services and experiments, I realized that observability—knowing what’s happening across all nodes—was becoming critical. Without proper monitoring, diagnosing issues, understanding resource consumption, and optimizing workloads becomes guesswork.
In my setup, the management node (Zeus) serves as the observability hub. Here's why that matters:
- Centralizing metrics makes it easier to analyze, visualize, and store data securely in one place
- It avoids SSH-ing into individual nodes to check CPU, memory, disk usage, or logs
- It enables long-term insights (e.g., performance trends, failure patterns)
- It helps automate alerts when something goes wrong
On Zeus, I'm running the following stack—all containerized with Docker for simplicity and portability:
- InfluxDB: A high-performance time-series database (TSDB) that stores metrics from Telegraf
- Loki: Log aggregation system that integrates directly with Grafana
- Grafana: Used to visualize metrics and logs from different sources
All nodes forward their data to Zeus, which acts as the collection, storage, and visualization layer. InfluxDB is one of the most widely-used time-series databases in the industry. According to multiple rankings, it's often at the top due to its performance and ecosystem. It’s also the engine behind Telegraf, making the integration seamless and efficient.
Metric Monitoring
Metrics are numerical data points collected over time (like CPU usage, memory, or request latency).
I am using Telegraf to collect system and service metrics from all Raspberry Pi nodes. Telegraf supports hundreds of input/output plugins, making it easy to collect everything from basic system metrics to Kubernetes stats or SNMP traps. I have enabled these input plugins:
| Plugin | Description |
|---|---|
[[inputs.cpu]] | Collects CPU metrics such as usage (user/system/idle), per-core and total. |
[[inputs.mem]] | Measures system memory usage (total, used, free, buffers, cached, etc.). |
[[inputs.swap]] | Tracks swap memory usage and activity (in/out). |
[[inputs.disk]] | Gathers disk usage metrics (used, free, total) per mount point. |
[[inputs.diskio]] | Reports disk I/O stats like read/write bytes, operations, and latency. |
[[inputs.system]] | Collects basic system info: uptime, load averages, and number of users. |
[[inputs.kernel]] | Collects general kernel-level stats like context switches and interrupts. |
[[inputs.processes]] | Reports process counts (running, sleeping, blocked, etc.). |
[[inputs.net]] | Gathers metrics on network traffic per interface (bytes, packets, errors). |
[[inputs.netstat]] | Collects protocol-level stats (TCP/UDP connections, states, retransmits). |
[[inputs.ping]] | Sends ICMP pings to hosts and tracks packet loss and latency. |
[[inputs.docker]] | Collects Docker container metrics including CPU, memory, network, and I/O. |
Configuring Telegraf
Using SaltStack, we can install telegraf across all the nodes.
$ sudo salt '*' pkg.version telegraf

artemis:
    1.34.1-1
ares:
    1.34.1-1
hermes:
    1.34.1-1
apollo:
    1.34.1-1
pihole:
    1.34.1-1
We then create a salt state to deploy the telegraf config to all nodes and restart the telegraf service.
/srv/salt/telegraf
├── deploy_conf.sls      # Deploys telegraf.conf and restarts service if changed
├── files
│   ├── telegraf.conf    # Symlink to /etc/telegraf/telegraf.conf
Create folder structure:
$ sudo mkdir -p /srv/salt/telegraf/files
$ sudo ln -s /etc/telegraf/telegraf.conf /srv/salt/telegraf/files/telegraf.conf
# /srv/salt/telegraf/deploy_conf.sls
/etc/telegraf/telegraf.conf:
file.managed:
- source: salt://telegraf/files/telegraf.conf
- user: root
- group: root
- mode: 0644
restart_telegraf:
service.running:
- name: telegraf
- enable: True
- watch:
- file: /etc/telegraf/telegraf.conf
To apply the sate to all nodes:
$ sudo salt -N core state.apply telegraf.deploy_confThis way, all minions receive the exact config from the master, and telegraf is restarted automatically if the file has changed.
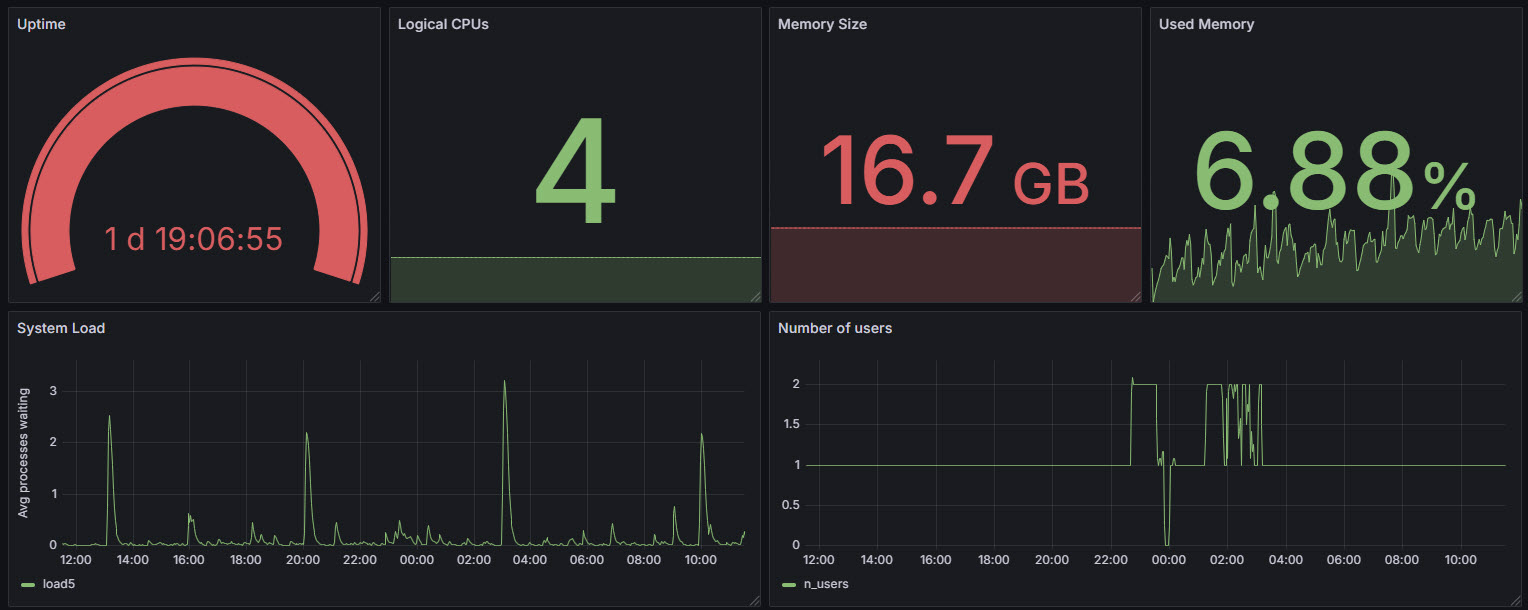
Metric Visualization
System information
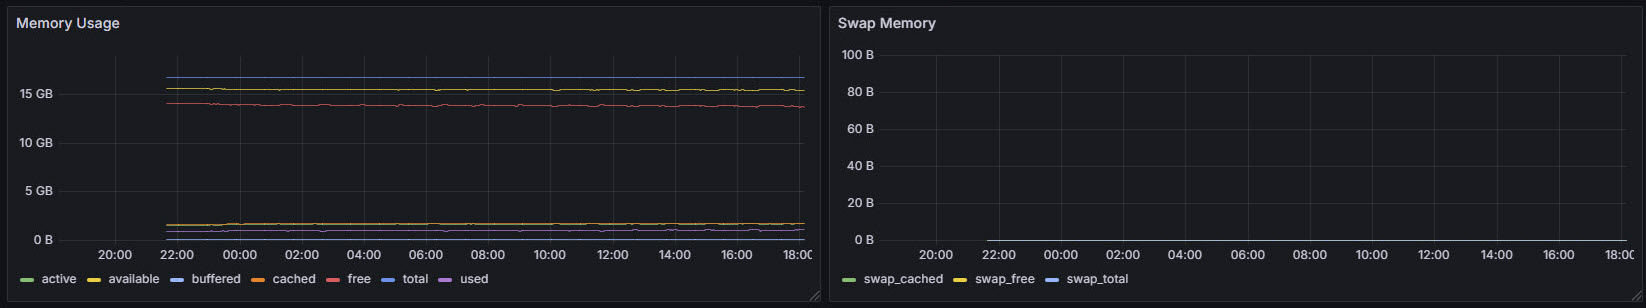
Memory information
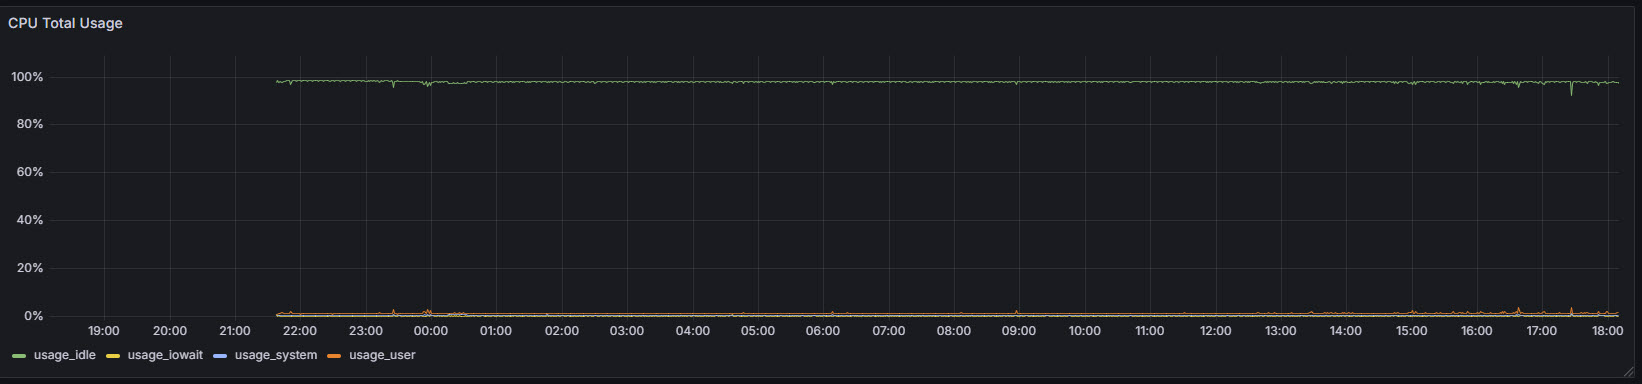
CPU usage information
Process Information
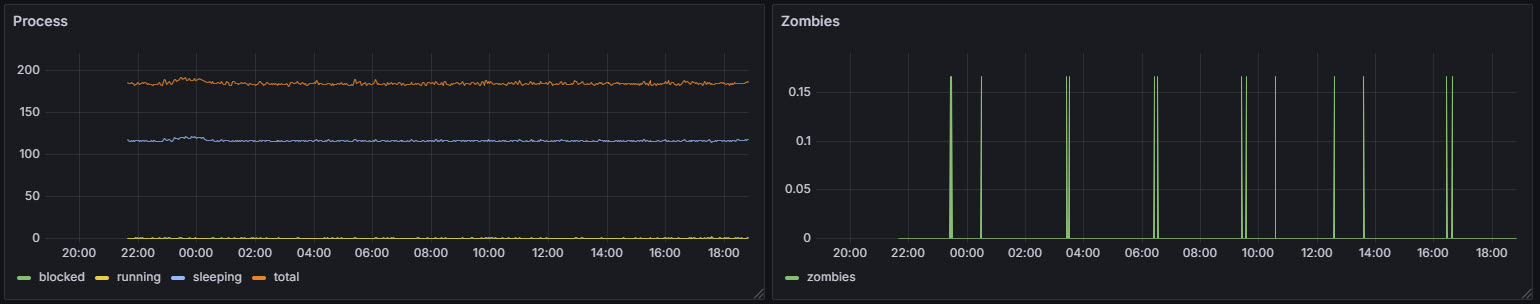
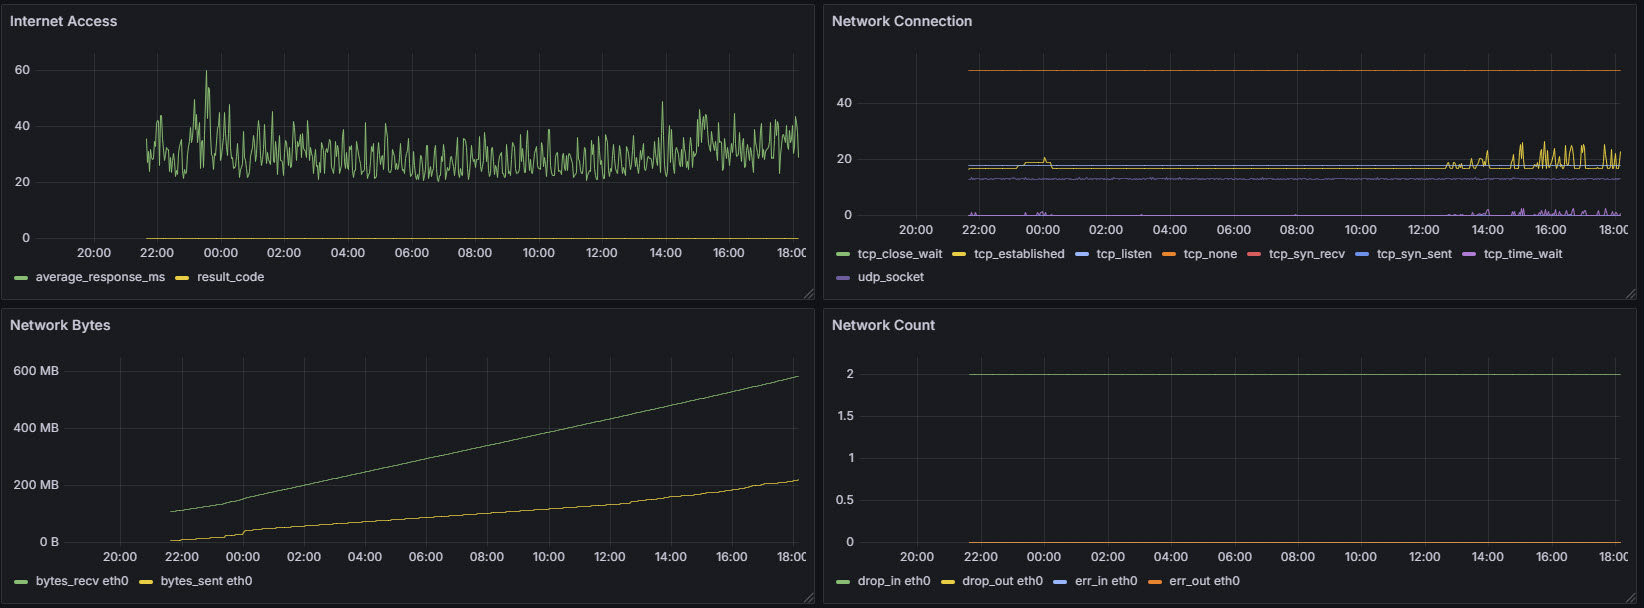
Network Information
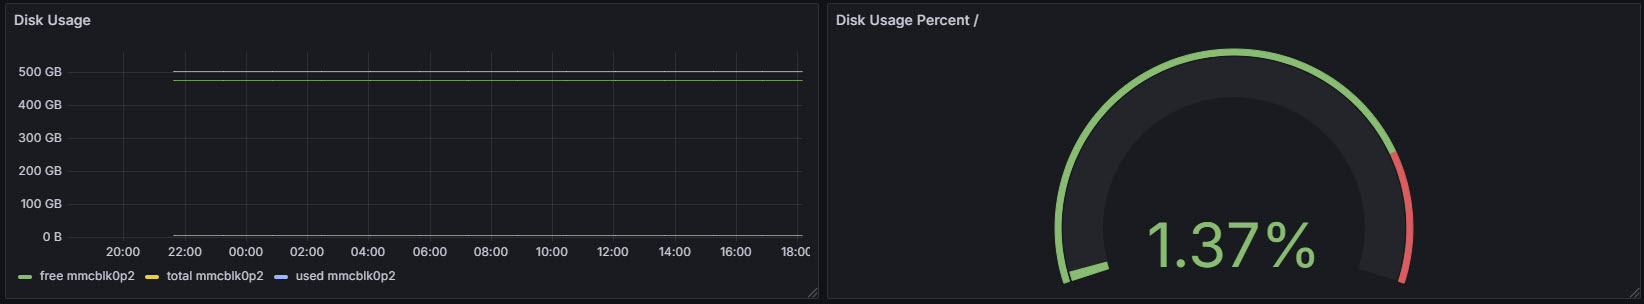
Disk usage
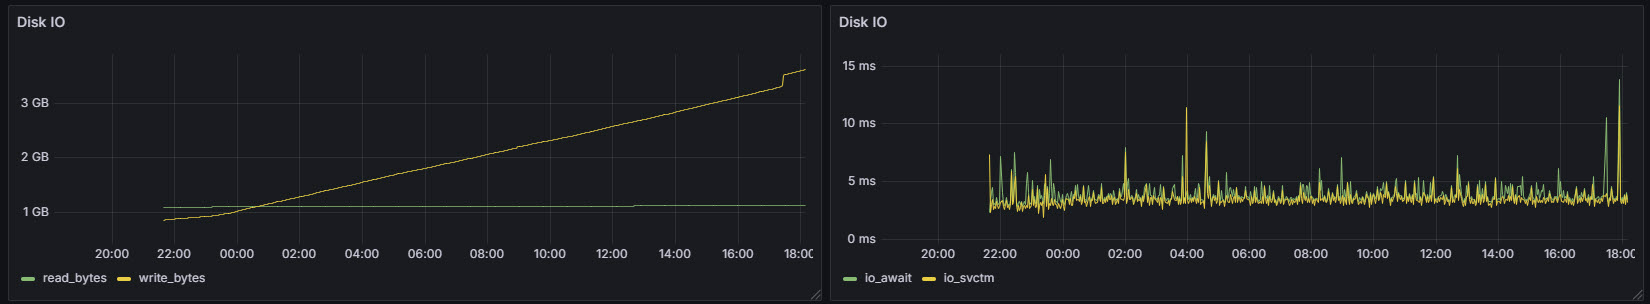
Disk IO
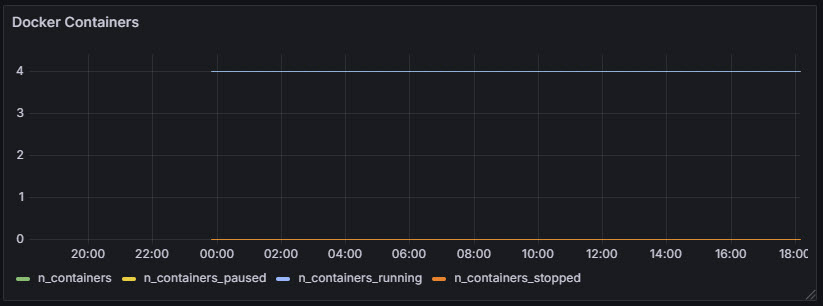
Docker Containers
Collecting CPU/RP1 Temperature
Collecting CPU temperature data from Raspberry Pi 5 nodes is important for several reason:
Monitoring Workload Impact: High CPU temperatures can correlate with heavy workloads or inefficient code. Tracking it helps with performance tuning.
Cooling System Validation: Checking CPU temps helps me validate that the cooling setup is working as expected. Here is an interesting article comparing different cooling solutions.
Hardware Protection: Overheating can shorten the lifespan of components. Monitoring allows you to react (e.g., increase fan speed) before it becomes dangerous.
Thermal Throttling Prevention: If the CPU gets too hot, it will throttle (reduce speed) to cool down, affecting performance. The CPU on a Raspberry Pi typically starts thermal throttling at around:
- 80°C (soft throttle): CPU frequency is reduced to prevent reaching critical levels.
- 85°C (hard throttle): More aggressive throttling or GPU may be scaled down.
- 90°C+: You risk system instability, shutdown, or hardware degradation.
The RP1 chip is a custom-designed I/O controller developed by Raspberry Pi Ltd. for the Raspberry Pi 5. It serves as a dedicated companion chip to offload and manage all input/output functions. It handles interfaces like USB 3.0, Ethernet, PCIe, GPIO, and built-in Analog-to-Digital Converter (ADC) capabilities. By offloading I/O from the main SoC (BCM2712), the RP1 improves overall performance and responsiveness. RP1 chip has a temperature sensor. This is important because RP1 can get hot under sustained USB or I/O load.
Here is a simple Python script that collects sensor data from a Raspberry Pi 5 node using psutil package.
#!/opt/my_venv/bin/python3

import psutil

temps = psutil.sensors_temperatures()

# {
#     'cpu_thermal': [shwtemp(label='', current=33.65, high=None, critical=None)],
#     'rp1_adc': [shwtemp(label='', current=47.337, high=None, critical=None)]
# }

for sensor_name, readings in temps.items():
    for i, sensor in enumerate(readings):
        label = sensor.label or f"{sensor_name}_{i}"
        value = sensor.current
        print(f"temperature,sensor={label} value={value}")

# temperature,sensor=cpu_thermal_0 value=34.2
# temperature,sensor=rp1_adc_0 value=45.013
To install psutil python package across all nodes in the cluster:
$ sudo salt -N core cmd.run 'sudo /opt/my_venv/bin/pip install psutil'Telegraf config looks like the following:
[[inputs.exec]]
  commands = ["/opt/rp_cluster/monitoring/read_temp.py"]
  interval = "10s"
  timeout = "5s"
  data_format = "influx"
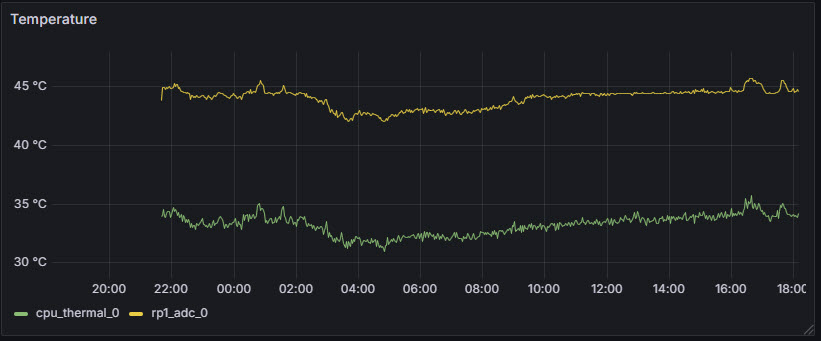
Visualization
Collecting CPU Frequency
Collecting CPU frequency helps us:
Monitor performance: Understand if the CPU is running at full speed or throttled. If the CPU gets too hot, it may reduce frequency to cool down.
Check power efficiency: Low frequency means lower power consumption (important for PoE setups).
Track CPU scaling behavior: Some workloads may not trigger the CPU to boost frequency — good insight for optimization.
CPU frequency scaling is a power management technique that allows the operating system to dynamically adjust the processor's clock speed based on workload demands. By scaling the CPU frequency up under heavy load and down when idle or under light usage, it helps balance performance with energy efficiency and thermal management.
A CPU governor is a kernel-level policy that determines how the CPU frequency should be adjusted in response to system load, balancing performance and power consumption. It works alongside the CPU frequency scaling driver to decide when to increase or decrease the clock speed.
| Governor | Description |
|---|---|
| performance | Runs the CPU at maximum frequency at all times for best performance. |
| powersave | Keeps the CPU at the lowest possible frequency to save power. |
| ondemand | Dynamically scales CPU frequency based on usage; responsive and efficient. |
| conservative | Similar to ondemand, but increases/decreases frequency more gradually. |
| userspace | Allows user-space programs to set CPU frequency manually. |
| schedutil | Uses the Linux scheduler to make frequency decisions; newer and efficient. |
Choosing the right governor is crucial for optimizing system behavior. On Raspberry Pi devices, tuning frequency scaling can optimize power usage, especially in cluster setups or PoE-powered environments.
To get a list of available governors in the system:
$ cat /sys/devices/system/cpu/cpu0/cpufreq/scaling_available_governors
conservative ondemand userspace powersave performance schedutil
To get the current governor (per CPU core):
$ cat /sys/devices/system/cpu/cpu0/cpufreq/scaling_governor
ondemand
To change governor for all CPU cores:
for cpu in /sys/devices/system/cpu/cpu[0-9]*; do
    echo ondemand | sudo tee "$cpu/cpufreq/scaling_governor"
done
We are collecting CPU frequency from all Raspberry Pi 5 nodes using psutil package. It will give us three values:
current: The current operating frequency (in MHz). This is what the CPU is running at right now.min: The lowest frequency the CPU is allowed to scale down to.max: The highest frequency the CPU can boost to under load.
#!/opt/my_venv/bin/python3

import psutil

freq = psutil.cpu_freq()

# scpufreq(current=1500.0, min=1500.0, max=2400.0)

print(f"cpu_freq_mhz current={freq.current},min={freq.min},max={freq.max}")

# cpu_freq_mhz current=1500.0,min=1500.0,max=2400.0
[[inputs.exec]]
  commands = ["/opt/rp_cluster/monitoring/read_freq.py"]
  interval = "10s"
  timeout = "5s"
  data_format = "influx"
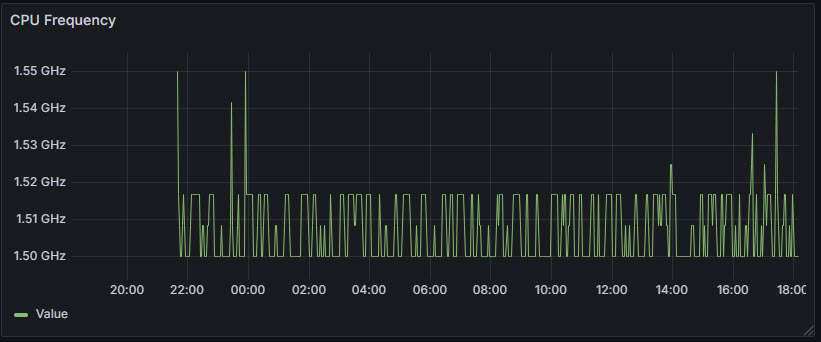
Visualization
Getting Throttled Status
Raspberry Pi’s throttled status can be retrieved with:
$ vcgencmd get_throttledIt provides a hexadecimal code that indicates current and past power or temperature-related performance limitations. Each bit in the returned value represents a specific condition. For example, bit 0 shows if the Pi is currently experiencing under-voltage. Bit 16 reveals if under-voltage occurred since the last reboot.
| Bit | Hex Mask | Meaning | Description |
|---|---|---|---|
| 0 | 0x00001 | Under-voltage now | Currently experiencing under-voltage |
| 1 | 0x00002 | Frequency capped now | CPU frequency is currently capped due to low voltage |
| 2 | 0x00004 | Throttled now | CPU is currently throttled due to low voltage or temperature |
| 3 | 0x00008 | Soft temperature limit active now | CPU is currently slowed due to reaching soft temp limit |
| 16 | 0x10000 | Under-voltage occurred | Under-voltage has occurred since last reboot |
| 17 | 0x20000 | Frequency capped occurred | Frequency capping has occurred since last reboot |
| 18 | 0x40000 | Throttling occurred | Throttling has occurred since last reboot |
| 19 | 0x80000 | Soft temperature limit occurred | Soft temperature limit was triggered since last reboot |
This diagnostic tool is essential for identifying insufficient power supplies or cooling issues that can impact system stability and performance. I wrote the following Python script to retrieve throttled_status value, parse it, and print the result in influx format.
#!/opt/my_venv/bin/python3

import subprocess

def get_throttled():

    result = subprocess.run(['vcgencmd', 'get_throttled'], capture_output=True, text=True)
    if result.returncode != 0:
        raise RuntimeError("Failed to run vcgencmd")
    value = result.stdout.strip().split('=')[1]
    return parse_throttled(value)


def parse_throttled(value):

    flags = int(value, 16)
    status = {
        "under_voltage_now":        bool(flags & 0x1),
        "freq_capped_now":          bool(flags & 0x2),
        "throttled_now":            bool(flags & 0x4),
        "soft_temp_limit_now":      bool(flags & 0x8),
        "under_voltage_occurred":   bool(flags & 0x10000),
        "freq_capped_occurred":     bool(flags & 0x20000),
        "throttled_occurred":       bool(flags & 0x40000),
        "soft_temp_limit_occurred": bool(flags & 0x80000),
    }
    return status


def print_influx_line(status):

    line = "rpi_throttled_status"
    fields = []
    for key, val in status.items():
        fields.append(f"{key}={int(val)}")
    print(f"{line} {','.join(fields)}")


if __name__ == "__main__":

    try:
        status = get_throttled()
        print_influx_line(status)
    except Exception as e:
        print(f"rpi_throttled_status error=1,message=\"{str(e)}\"")
[[inputs.exec]]
  commands = ["/opt/rp_cluster/monitoring/rpi_throttled_status.py"]
  interval = "5s"
  timeout = "5s"
  data_format = "influx"
vcgencmd command is not accessible to the telegraf user. It needs access to /dev/vchiq, which is typically restricted. We can add telegraf to the video group. Using SaltStack, I can apply this change across all nodes in the cluster:
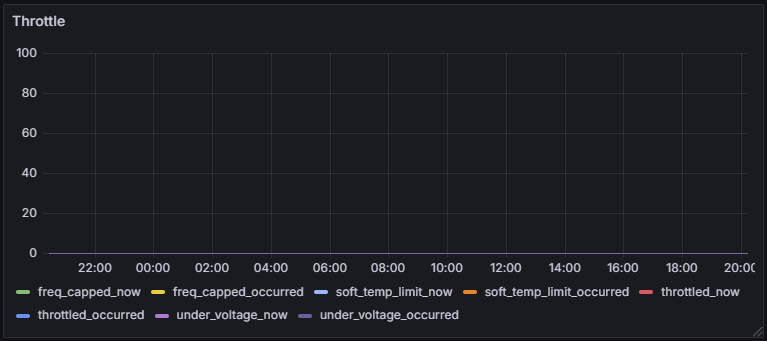
$ sudo salt -N core cmd.run 'sudo usermod -aG video telegraf'Visualization
Stress Testing
Stress testing is a type of performance testing where you push a system to its maximum capacity to see how it behaves under extreme conditions. It's like giving the system a workout to make sure it doesn't overheat, crash, or behave unpredictably under heavy load. Stress testing helps us:
- Check system stability
- Evaluate power and cooling performance
- Ensure thermal throttling doesn’t kick in prematurely
stress-ng (stress next generation) is a powerful stress-testing tool that lets you stress:
- CPU
- Memory
- I/O
- Filesystem
- Network
- GPU (somewhat)
- Custom kernel interfaces
The Raspberry Pi 5 has 4 logical CPU cores. To stress all 4 for 60 seconds, you can use the following command:
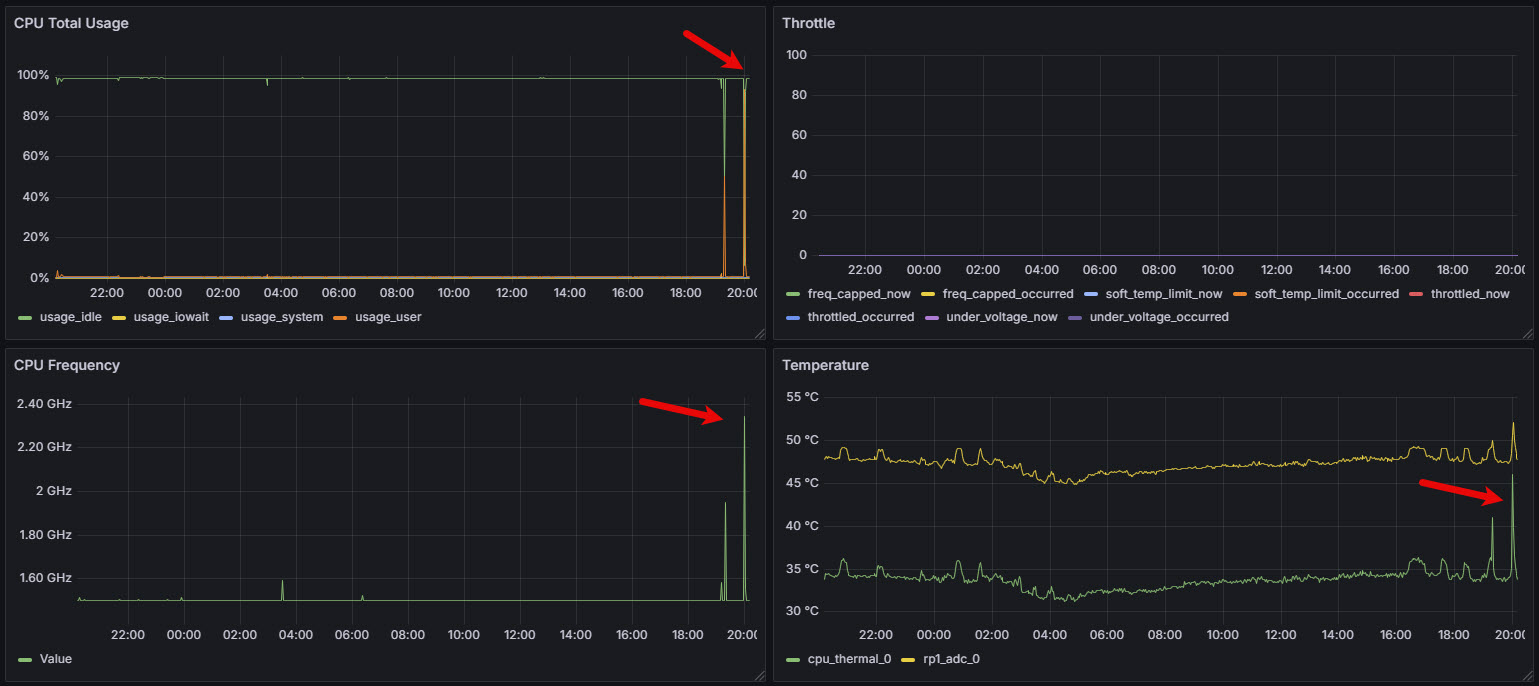
$ stress-ng --cpu 4 --timeout 120sWe can run really harsh loads by performing matrix multiplication to stress CPUs — great for thermal testing:
$ stress-ng --cpu 4 --cpu-method matrixprod --timeout 120sThe collected CPU metrics clearly show the sudden jump in usage, temperature and frequency.
To perform memory stress test where we spawn 2 memory workers, each allocating 512MB:
$ stress-ng --vm 2 --vm-bytes 512M --timeout 120sTo perform I/O stress test by writing 1 GB to disk in chunks:
$ stress-ng --hdd 1 --hdd-bytes 1G --timeout 120sTo benchmark system performance:
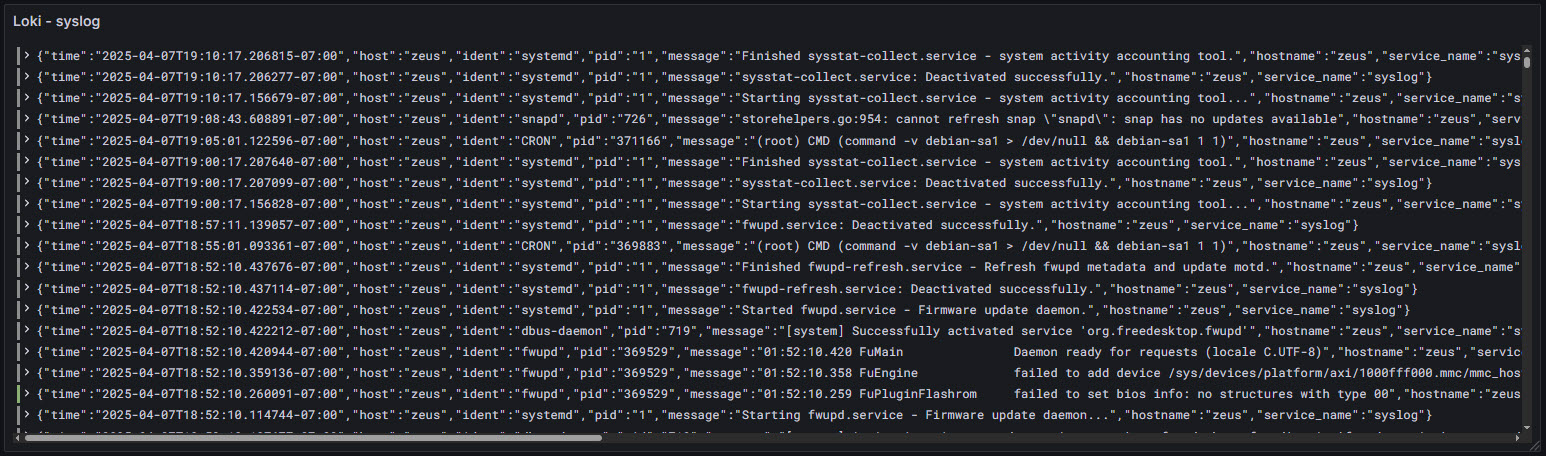
$ stress-ng --cpu 4 --metrics-brief --timeout 30sLog Monitoring
Logs are detailed, timestamped records generated by systems and applications, capturing context-rich information useful for debugging and auditing.
I'm using Fluent Bit as my log collection agent due to its lightweight footprint, high performance, and rich support for a wide range of input sources and output destinations. It is designed specifically for modern, resource-constrained environments like containers and edge devices. Its active development community and native support for Kubernetes further enhance its suitability for modern infrastructure.
While Fluent Bit allows forwarding logs directly to a database (such as InfluxDB, PostgreSQL, or TimescaleDB), it's generally more effective to send logs to a dedicated log aggregator like:
- Graylog
- Logstash
- Fluentd
- Loki
These systems are purpose-built for log ingestion, parsing, enrichment, storage, and querying, offering robust features such as alerting, filtering and correlation. Since I am using Grafana as my primary visualization tool, Loki is the most natural and tightly integrated log aggregator to choose.
Unlike traditional aggregators that rely on full-text indexing (such as Elasticsearch or OpenSearch), Loki uses label-based indexing, which is more efficient and cost-effective, especially at scale. Loki's native support in Grafana ensures a streamlined setup, faster querying, and a more consistent observability experience—making it the best choice when Grafana is already your visualization tool.
I have configured Fluent Bit to collect logs from these sources:
| Log Source | Description |
|---|---|
/var/log/syslog | General system messages — useful for monitoring a broad range of system events. |
/var/log/auth.log | Tracks SSH logins, sudo usage, failed logins, etc. |
/var/log/kern.log | Kernel messages — helpful for detecting hardware or driver-related issues. |
/var/log/dmesg | Boot and hardware-related logs — useful for debugging hardware/startup issues. |
/var/log/dpkg.log | Package installation/removal logs — good for auditing changes. |
systemd journal | Logs from all systemd services — useful for deep insight into service activity. |
/var/log/nginx/error.log | NGINX error logs — helps identify web server problems. |
/var/log/nginx/access.log | NGINX access logs — useful for traffic analysis and access patterns. |
docker logs | Logs from running containers — essential for monitoring containerized apps. |
Loki uses a query language called LogQL. It is inspired by PromQL (the Prometheus Query Language) but tailored specifically for logs. LogQL allows you to:
- filter logs using label selectors (like
{hostname="node1"}) - perform full-text searches (
|= "error") - run metric queries like
count_over_timeorrate